


24 December 2020
5 Min Read

This is part three of a four-part series on how L&D teams can effectively evaluate, measure, and demonstrate the business impact of their learning and development programs.
In part one of this series, we began by honoring the reality of the pandemic’s impact on L&D and the need for organizations to “reset.” Part two introduced the importance of collaborating with departments outside of HR and L&D to align learning and talent functions with the overall business strategy.
That brings us to part three. Once you know how to align learning and talent with your organization’s key business strategies, you can start focusing on metrics. By ‘leveling up’ the learning data you’re currently tracking, you can then establish a link between your learning metrics and the KPIs associated with your organization’s business objectives.
What Do L&D Teams Typically Measure?
Many L&D teams are in the same boat. They rely solely on their LMS to deliver reporting and analytics, which means they may be under-reporting. There are six measures that are used most frequently:
- Hours of training delivered
- Completion rates
- Compliance rates
- Training scores
- Satisfaction ratings (smile sheets)
- Cost of training
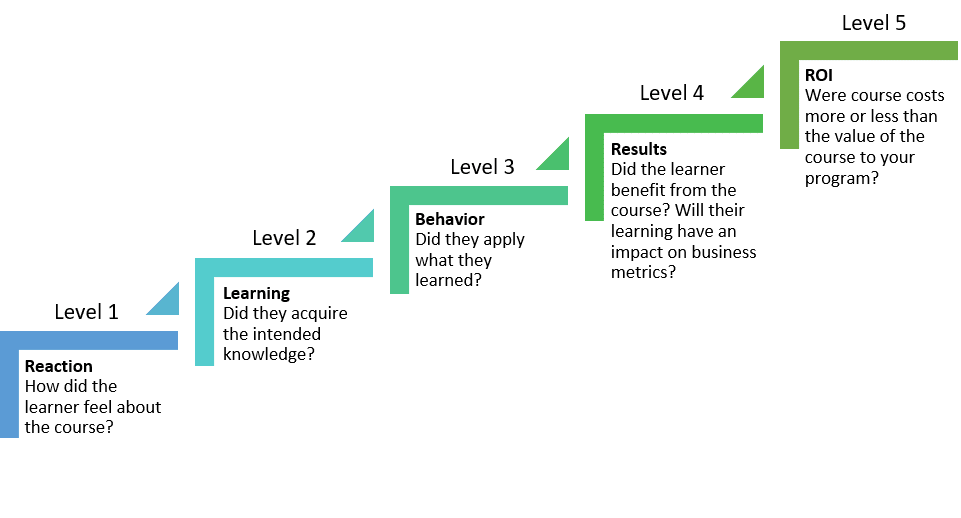
But these measures don’t really help L&D and HR teams ‘level up.’ If you recall the Kirkpatrick Model, most of the six measures above align with levels one, two, or three, as shown below.
The ‘Table Stakes’ of Learning Metrics
Traditional learning data is fairly straightforward, but you must also consider the experience of the learner, the program, and the learner’s needs.
Let’s start with the ‘table stakes.’ Usually, this is the learning data that can be organized around many different contexts. But overall, it is to ensure you’re tracking three things:
- Learner-based metrics or learner activities—Completions, time spent, exam scores, number of attempts
- Learning experience—Satisfaction, technology, delivery formats
- Learning program—Content applicability, drop-off rate, exam success rates
But there’s still so much more to explore. To go to the next level, you also need to consider the measurement of “benefit” and “business impact.”
Benefit-Based Metrics
Hard benefits are those that (a) can be attributed solely to the training program, and (b) can be assigned a specific financial value. Soft benefits are those that (a) cannot be solely attributed to the training program, and/or (b) cannot be readily assigned a specific financial value.
Hard Benefits—A specific benefit like achieving a targeted goal, i.e., a total reduction in costs of a new program compared to a prior version
Soft Benefits—Anecdotal, where training contributes alongside other programs or tactics like increased productivity, reduced absences, or greater customer satisfaction
Business Impact Metrics
Business impact metrics connect back to business strategy and KPIs. They provide the opportunity to connect all the dots between the skill and competency focus of training programs, and the link between that and the key strategies and KPIs. This way, you can determine the net impact your training has on the business.
Potential training and learning data metrics you may want to correlate with your KPIs include:
- Revenue per employee
- Profitability
- Revenue growth
- Customer satisfaction
- Voluntary turnover/retention
- Employee engagement
- Business process improvement
- Individual performance
- Team effectiveness
- Ability to respond to the market
Using Data to Guide Future Success
As you can see, data and analytics are necessary to help you make the shift from reactive to proactive and strategic when you think about your training programs.
Instead of fighting fires all the time, you can be more future-focused when you look at competencies, skills, and other elements of learning design so you can identify all the levers available to pull.
This also allows you to move to a more predictive analytics stage where the data will help you understand and predict where to place your emphasis.
For example, if you know turnover is a problem and you can identify some of the drivers behind it (e.g., poor leadership effectiveness or communication skills), you can roll out learning and development programs that are geared to support the individual underlying competencies.
This strengthens performance in a more sustainable way across the organization. It is also far more effective than building a course solely focused on addressing turnover.
Check out the final article of this series, where we focus on turning all of these insights into action and uncover the essential metrics every L&D team should be tracking.
RELATED RESOURCES